Identification of Extra Cellular Matrix (ECM) Genes in Triple Negative Breast Cancer
Download
Abstract
Introduction: Extracellular Matrix (ECM) is often abnormally produced, degraded, and remodelled, which creates a pro-tumorigenic environment in cancer and leads to tumor growth, angiogenesis, invasion and metastasis. This study aimed to investigate ECM genes by microarray-based transcriptome analysis and miRNA that target ECM genes in triple-negative breast cancer (TNBC).
Materials and Methods: The current study evaluated 682 TME-related genes using Array Comparative Genomic Hybridization (aCGH) in 55 patients with TNBC.
Results: 266 ECM genes were studied by transcriptome analysis, and it was observed that 132 ECM genes were up-regulated and 25 ECM genes were down-regulated in TNBC. Regarding upregulated genes, the majority of the genes were of Collagen family genes. Regarding downregulated genes, 14 genes were of Integrin family genes. PPI network analysis of upregulated genes using the STRING database, five hub genes identified were FN1, COL3A1, COL1A2, COL1A1, and COL6A2. Five of eight ranking methods identified FN1 and COL1A1 as the top most upregulated hub genes. The top 5 significant down-regulated hub genes were ITGB2, ITGAM, ITGAX, ITGB3, and ITGA4. Of 8 ranking methods, 7 ranking methods identified ITGB2, ITGAM and ITGAX as the most significant down-regulated hub genes. Further, target gene - miRNA regulatory networks using the miRTargetLink 2.0 tool.
Conclusion: ECM genes FN1, COL1A1, ITGB2, ITGAM and ITGAX may be involved in disease progression in TNBC and, after validation, may be considered therapeutic targets for TNBC
Introduction
The tumor microenvironment (TME) comprises a variety of cellular components, including immune cell types, endothelial cells, pericytes, fibroblasts, adipocytes and a cellular component extracellular matrix (ECM). The ECM is a general scaffold to maintain tissue and organ homeostasis [1]. It is also a critical component of the cancer microenvironment that supports tumorigenesis [2]. The activity of immune cells, other stromal cells, and fibroblasts linked to cancer can be influenced by extracellular matrix (ECM), and these interactions can create a supportive niche for tumor growth and immune evasion. It has the ability to prevent infiltration of immune cells, protecting tumor cells from immune surveillance. Furthermore, certain ECM components can have immunosuppressive effects, further aiding in immune evasion and influencing tumor growth, angiogenesis, invasion, and metastasis [3].
Triple-negative breast cancer (TNBC) is a subtype of breast cancer characterized by the absence of estrogen receptors (ER), progesterone receptors (PR), and human epidermal growth factor receptor 2 (HER2). As TNBC lacks these receptors, it does not respond to hormonal therapies or therapies that target HER2, making it more challenging to treat. ECM components can contribute to therapeutic resistance in TNBC, making it harder to treat with conventional methods. In order to create TNBC treatments that are more successful, research is focused on finding biomarkers connected to extracellular matrix (ECM) and possible therapeutic targets.
In this study, ECM genes were evaluated by microarray-based transcriptome analysis in triple negative breast cancer (TNBC). Further, hub genes and target miRNA were identified.
Materials and Methods
Patients
This retrospective study included a total of 100 patients with Triple Negative breast cancer (TNBC: ER-PR-Her2-) diagnosed and treated between the years 2013-2017 at the Gujarat Cancer and Research Institute. ER, PR and Her2/neu receptor status were evaluated by immunohistochemistry on the Ventana Benchmark XT autostainer using commercially available respective Ventana rabbit monoclonal antibodies (ER clone SP1, PR clone 1E2, Her2 Clone 4B5). The formalin-fixed paraffin-embedded (FFPE) tissue samples of the TNBC patients with a five-year follow-up were collected from the tissue repository of the institute. The primary treatment given to the patients was surgery followed by adjuvant chemotherapy. These patients were followed for a period of five years and disease status was recorded. During this period, 9 patients underwent disease remission and 46 patients developed disease relapse (bone metastases N=1, brain metastases N=3, lung metastases N=12, liver metastases N=7, local recurrence N=8, multiple metastases N=15). The FFPE samples were later subjected to transcriptome workflow preceded by isolation of nucleic acids using the Qiagen FFPE kit for RNA (as per manufacturer’s protocol) for Transcriptome studies.
Transcriptome Analysis
In this study, 3–4 sections of 5μm each from FFPE blocks were cut, and total RNA was isolated using RNeasy FFPE kit (Qiagen, USA) in Qiacube HT as per manufacturer’s instructions. Qualitative and quantitative analysis of isolated RNA samples was determined using microfluidic electrophoresis (Agilent Bioanalyzer 2100) and Qubit 3 (Invitrogen), respectively.
For quality assessment of extracted total RNA from FFPE-derived samples, they were loaded on an Agilent RNA Nano Chip to quantify RNA and to determine its integrity. It is difficult to distinguish rRNA peaks in FFPE samples, so the RIN values were determined and DV200 values were calculated for the selection of high-quality RNA. A long and broad peak is visible in the RNA electrogram for FFPE samples, which indicates the high number of long RNA fragments. All the samples’ RNA integrity number (RIN) and DV200 values were checked by Bioanalyzer. The RIN and DV200 values were between 2.3 to 2.5 and 31 to 51, respectively.
Transcriptome analysis was done using Agilent’s one-colour Microarray-based gene expression analysis. A total of 300ng of FFPE extracted RNA was subjected to gene expression workflow. The total RNA was first reverse-transcribed to a dscDNA library using WTA Library preparation kits (Sigma) and later amplified to cDNA library preparation using WTA Library Amplification kits (Sigma). The resulting amplified products were purified using QIAquick PCR Purification Kits. For labeling, purified cDNA was taken and labeled with Cyanine 3-dUTP fluorescent dye, using a SureTag DNA labeling kit (Agilent), and the yield and specific activity of the sample and dye were calculated, respectively. After purification of the labeled cDNA product, the samples were subjected to hybridization on SurePrint G3 Human Gene expression v3 8X60K slide, at 65⁰C for 17 hours at 20 rpm. After hybridization, the microarray slide was washed using wash buffers (Agilent) and scanned in a microarray scanner (Agilent Sure Scan Microarray scanner). Later, feature extraction was carried out and data was analyzed using GeneSpring software. The fold change was kept at >2 in Gene Spring software.
miRNA Microarray Analysis
A miRNA study was carried out using Agilent’s One- colour Microarray-based gene expression. A total of 100ng of FFPE-extracted RNA samples were subjected to miRNA microarray workflow and treated with a labelling Spike-IN reagent. Further, the RNAs were dephosphorylated using CIP Phosphatase master mix. The dephosphorylated RNAs were subjected to a labelling mix with Cyanine 3-dUTP fluorescent dye, using a miRNA complete labelling and Hybridization kit (Source: Agilent). However, post labelling reaction, the resulting samples were purified, concentrated and dried using a vacuum concentrator (pertaining to the small size of miRNAs).
The concentrated samples were then subjected to hybridization reaction using Hyb Spike-In using G3 Human miRNA Microarray slide R21, 8X60K, and hybridized for 20 hours at 20 rpm and 55°C. After hybridization, the slide was washed with gene expression wash buffers 1 and 2 (Provided in kit) and later scanned in Agilent Sure Scan scanner.
The resulting .tif image is then feature extracted using Agilent Feature extraction software to check the QC of the acquired samples; and later the generated .txt files are then further analyzed using Gene Spring software, version 14.9.1.
Results
ECM Gene Analysis
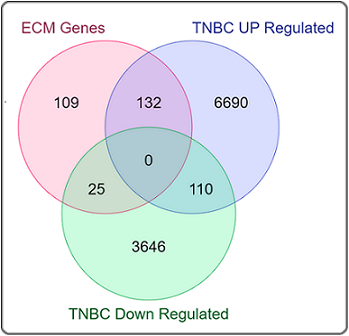
The previous study on transcriptome analysis of TNBC found upregulation of 6800 genes and downregulation of 3646 genes. Of them, 266 genes were ECM genes, and it was observed that 132 genes were up-regulated and 25 genes were down-regulated in TNBC (Figure 1).
Figure 1. Venn Diagram for Upregulated and Downregulated ECM Genes in TNBC.
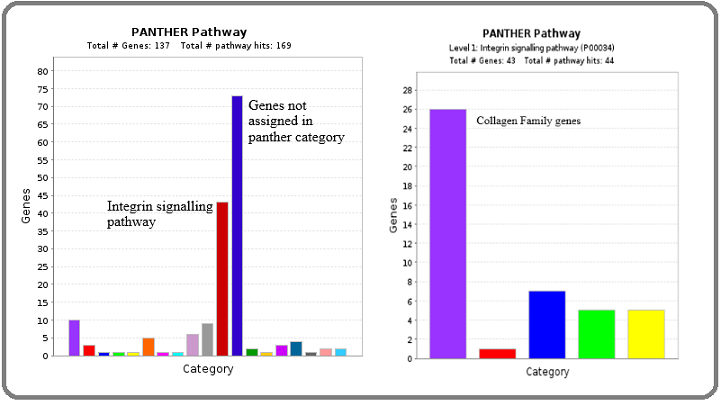
Further, Panther pathway analysis was performed for upregulated and downregulated ECM genes. Regarding upregulated genes, 73 genes were not assigned to the Panther category, whereas 43 genes were of the Integrin signaling pathway. The majority of the genes (26/43) were of Collagen family genes (Figure 2).
Figure 2. Identification of Major Pathways Involved with Up-regulated Hub Genes by Panther Pathway Analysis.
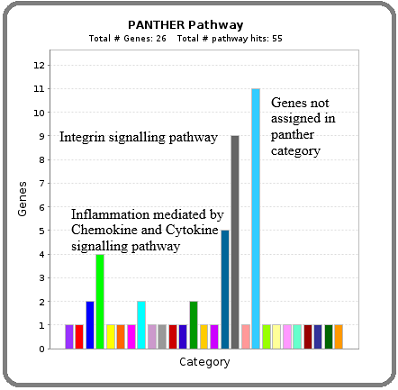
Regarding downregulated genes, 11 genes were not assigned to the Panther category, whereas 9 genes were of the Integrin signaling pathway and 5 genes were from Inflammation mediated by the Chemokine and Cytokine signaling pathway. These 14 genes were Integrin family genes (Figure 3).
Figure 3. Identification of Major Pathways Involved with Down Regulated Hub Genes by Panther Pathway Analysis.
PPI network analysis
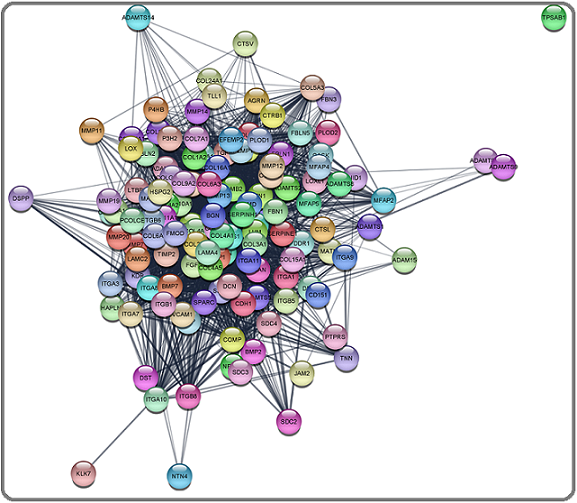
Then up-regulated and down-regulated genes were subjected to protein-protein interaction (PPI) network analysis to identify the key genes using the STRING database. The 132 upregulated genes were input into the STRING database for PPI network analysis, and achieved a PPI network of 132 nodes and 2587 edges (Figure 4).
Figure 4. Main Connected Component of Protein-protein Interaction Network of Upregulated ECM Genes in TNBC. The Component Includes 132 Nodes Including 2587 Edges.
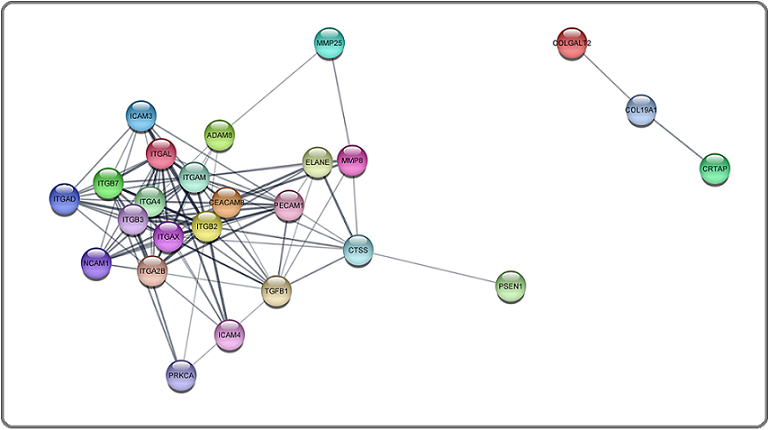
The 25 downregulated genes were input into the STRING database for PPI network analysis, and achieved a PPI network of 15 nodes and 110 edges (Figure 5).
Figure 5. Main Connected Component of Protein-protein Interaction Network of downregulated ECM Genes in TNBC. The Component Includes 25 Nodes Including 110 Edges.
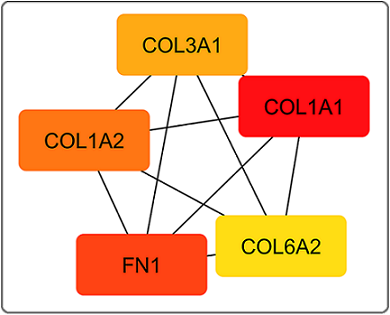
The data from the STRING analysis was imported into Cytoscape, analysed by the Cytohubba plugin and identified the top 5 up-regulated and top 5 down-regulated genes by Degree as a ranking method. The top five significant up-regulated hub genes were FN1 (Fibronectin 1), COL3A1 (Collagen, Type III, alpha 1 chain), COL1A2 (Collagen, Type I, alpha 2 chain), COL1A1 (Collagen, type I, alpha 1 chain) and COL6A2 (Collagen, type VI, alpha 2 chain) (Figure 6).
Figure 6. Top 5 Upregulated Hub Genes Identified by CytoHubba Cytoscape Plugin. Genes with the highest number of connections in the network are detected as hub genes. The image shows the degree of importance of hubs through a colour scale ranging from red (the most important) to yellow (less important).
Of 8 ranking methods, 5 ranking methods identified FN1 and COL1A1 as the most significant up-regulated hub genes. The top 5 significant down-regulated hub genes were ITGB2 (Integrin subunit beta 2), ITGAM (Integrin subunit alpha M), ITGAX (Integrin subunit alpha X), ITGB3 (Integrin subunit beta 3), and ITGA4 (Integrin subunit alpha 4) (Figure 7).
Figure 7. Top 5 Down Regulated Hub Genes Identified by CytoHubba Cytoscape Plugin. Genes with the highest number of connections in the network are detected as hub genes. The image shows the degree of importance of hubs through a colour scale ranging from red (the most important) to yellow (less important).
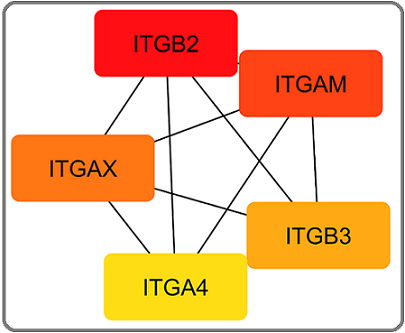
Of 8 ranking methods, 7 ranking methods identified ITGB2, ITGAM and ITGAX as the most significant down-regulated hub genes.
Construction of target gene - miRNA regulatory network
Moreover, the miRTargetLink 2.0 tool was used to determine miRNA involved in the regulation of FN1 and COL1A1 genes as well as the ITGB2, ITGAM, and ITGAX genes. Strong validation of miRNAs for FN1 and COL1A1 and weak validation of miRNA for ITGB2 and IGAX was observed. The hsa-let-7g-5p, hsa-miR-1-3p, hsa-miR-140- 3p, hsa-miR-200b-3p, hsa-miR-200c-3p targeting the FN1 gene and down-regulation of these 5 miRNAs observed in our study leads to activation of FN1 (Figure 8).
Figure 8. Gene - miRNA- network for FN1 and COL1A1 Genes.
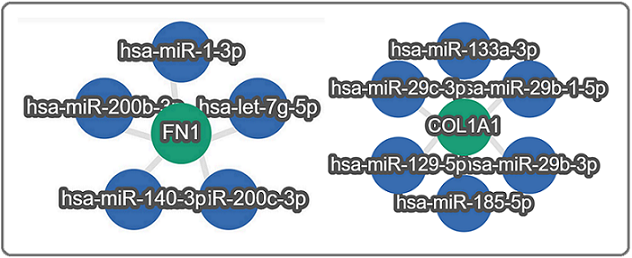
Similarly, down regulation of hsa-miR-129-5p, hsa-miR-133a-3p, hsa-miR-185-5p, hsa-miR-29b-1-5p, hsa-miR-29b-3p, hsa-miR-29c-3p cause activation of COL1A1 (Figure 9).
Figure 9. Gene - miRNA- network for ITGB2 and ITGAX Genes.
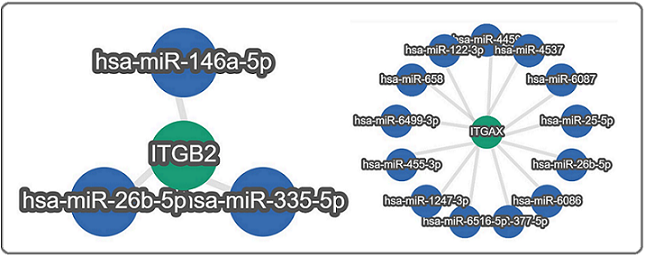
For down-regulated genes ITGB2, ITGAM, and ITGAX, weakly validated miRNA was observed. The hsa-miR- 146a-5p, hsa-miR-26b-5p, and hsa-miR-335-5p target the ITGB2 gene; however, down-regulation of these 3 miRNAs was observed. Further, hsa-miR-122-3p, hsa- miR-1247-3p, hsa-miR-25-5p, hsa-miR-26b-5p, hsa-miR- 377-5p, hsa-miR-4459, hsa-miR-4537, hsa-miR-455-3p, hsa-miR-6086, hsa-miR-6087, hsa-miR-6499-3p, hsa- miR-6516-5p, and hsa-miR-658 target ITGAX gene and down regulation of these 15 miRNAs except hsa- miR-6086 was noted. Up-regulation of hsa-miR-6086, which functions in the inhibition of angiogenesis, and down-regulation of one novel hsa-miR-4459 were found. For the ITGAM gene as a target, no miRNA was identified by the miRTargetLink 2.0 tool.
Discussion
The present study evaluated ECM genes from transcriptome profiling in TNBC. The upregulated ECM genes were of the Integrin signaling pathway and 60% of genes in the Integrin signaling pathway were of collagen family genes. PPI network analysis of upregulated genes using the STRING database, five hub genes identified were FN1, COL3A1, COL1A2, COL1A1, and COL6A2. Five of eight ranking methods identified FN1 and COL1A1 as the top most upregulated hub genes. One important ECM component, collagen, may help cancer cells decrease apoptosis and modify angiogenesis, which progressively accelerates the growth of cancer [4, 5]. Furthermore, intertumoral hypoxia may also result in elevated collagen deposition when breast cancer advances, according to Gilkes et al [6]. In our previous study, FN1 and COL6A2 protein expression was associated with poor overall survival [7]. Increased expression of collagen genes, such as COL1A1, COL14A1, COL5A1, COL6A1, and COL6A2, was linked to poor overall survival rates of BC patients, according to survival analysis in a study by Zhang et al [8]. This finding supports the theory that collagen may contribute to tumor progression and result in a poor prognosis. A study by Chen et al, high expression of FN1, particularly in Luminal A and TNBC subtypes, was seen in tumor tissues and was linked to a dismal prognosis. In-vitro and in-vivo experiments revealed that silencing FN1 inhibits the YAP1/Hippo pathway activation by increasing YAP1 phosphorylation, down-regulates tumor cell uptake and utilization of aspartate, inhibits the proliferation, invasion, and migration of breast cancer cells, and stimulates apoptosis. Additionally, tumor growth can be efficiently inhibited by inhibiting FN1 in conjunction with a YAP1 inhibitor or an SLC1A3 inhibitor; however, inhibiting FN1 in conjunction with a YAP1 inhibitor is more effective [9]. Concordant to the findings of the present study, Wang et al. by network analysis using the GSE26910 and GSE10797 datasets, found six important genes: JUN, FOS, ATF3, STAT1, COL1A1, and FN1. Notably, the cancer stromal essential genes COL1A1 and FN1 were linked to the invasion and metastasis of breast cancer. COL1A1 and FN1 high expression levels have been linked to an advanced stage of breast cancer and poor clinical outcomes using Oncomine gene expression array datasets [10]. Furthermore, a high expression of COL1A1and FN1 increases the likelihood of metastasis of multiple human solid tumors by promoting angiogenesis and epithelial–mesenchymal transition [11-13].
Regarding downregulated genes, they were of the Integrin signaling pathway and Inflammation-mediated Chemokine and Cytokine pathways. PPI network analysis of downregulated genes using the STRING database identified five hub genes, which were ITGB2, ITGAM, ITGAX, ITGB3, and ITGA4 that code for integrin α and β subunits. Seven of eight ranking methods identified ITGB2, ITGAM and ITGAX as the top most downregulated hub genes. Most integrins act as promoters of tumorigenesis and some integrins act as suppressors of tumorigenesis [14]. The ITGB2 gene is known as β2 integrins, which combines with multiple different alpha chains to form different integrin heterodimers and is found embedded in the membrane that surrounds white blood cells (leukocytes). α2β1 integrin is highly expressed on normal breast epithelium and reported to be a metastasis suppressor in mouse models and human breast cancer. However, other studies have suggested the α2β1 ITGAM gene encodes the integrin alpha M chain. The alpha M beta 2 integrin is important in the adherence of neutrophils and monocytes to stimulated endothelium, and also in the phagocytosis of complement-coated particles. ITGAX (Integrin alpha x), a member of the integrin family, usually serves as a receptor of the extracellular matrix and stimulates angiogenesis through the PI3K/Akt signaling-mediated VEGFR2/ VEGF-A overexpression during cancer development [15]. Contradictory findings were reported regarding these genes in human cancers. A study by Rojas et al. has found seven genes: ITGA4, ITGB2, ITGAX, ITGB7, ITGAM,
ITGAL, and ITGA8, which indicate a good prognosis in Basal-like and HER2 positive breast tumors. Their expression was positively correlated with T-cell activation and antigen presentation markers, immune surveillance gene signatures (cytotoxic T lymphocyte activation and IFN gamma signature), and the presence of immune cell infiltrates within the tumor (dendritic cells, CD4+T-cells, neutrophils, CD8+ T-cells, and B-cells) [16]. Another study on TNBC demonstrated that expressions of ITGB2, RAC2, ITGAM, and CXCL10 were significantly correlated with a good prognosis in TNBC and may be potential therapeutic targets for the development of gene therapies for TNBC patients [17]. The down-regulation of ITGB2, ITGAM and ITGAX genes might be associated with disease aggressiveness, which is also observed in the present study. In the non-small cell lung cancer (NSCLC) study, expression of ITGB2 in NSCLC tissue was significantly reduced compared with adjacent lung tissue and was related to the stage of NSCLC patients. In addition, the low expression of ITGB2 was associated with worse overall survival and the findings suggested that ITGB2 may be a molecular diagnostic target or therapeutic marker for lung adenocarcinoma and lung squamous cell carcinoma patients [18]. Contrary to these findings, Kim J et al reported that ITGAM and ITGA1 seem to enhance distance metastasis via integrin signaling and coagulation cascading in TNBC [19]. In ovarian cancer, 14 genes were identified based on risk score, including ITGAM, ELN, FBLN1, ANGPT2, FBL, COMP, PPL, PLD2, PDLIM4, EMP1, MYCFRAT2, WDR45, and ADSL, could predict the prognosis of patients with ovarian cancer [20]. ITGAM is a potentially significant gene which plays a key role in the metastasis of high-grade serous ovarian cancer [15]. In the ITGAM knockout mice, tumor growth and immunosuppressive cytokine mRNA levels are enhanced [21, 22]. A computation analysis using two normalized microarray datasets from the GEO database between Asian (GSE33926) and non-Asian populations (GSE46581) has shown down-regulation of ITGAX, CCL21, CCL3, CAMP, ITGAL, TNFRSF genes
in non-Asian populations and found to be important for TNBC cell migration [23]. Also, Otohinoyi D et al investigated possible oncogenic interactions between somatic mutations and the tumor-immune microenvironment in TNBC and discovered differences in somatic mutation profiles between patients who died and those who survived. Among the genes differentially mutated between two patient populations, the top ten highly significantly mutated genes associated with the deceased group include TP53, ACE, LAMB4, ITGAX, LRP2, FBXW7, BRCA1, NSD1, NCOR1, and NLRC5
and noted somatic mutation frequency of ITGAX is less in deceased group than alive group of TNBC patients [24]. In clear cell renal carcinoma (CCRCC), ITGAX, LAPTM5, and SERPINE1 levels in CCRCC tumor tissues were significantly higher than those in normal tissues and were associated with poor prognosis. Further, the ROC curve shows that ITGAX, LAPTM5, and SERPINE1 have good diagnostic value with good specificity and sensitivity [25]. In colorectal adenocarcinoma, a novel integrin-related ITGA/ITGB-related prognostic signature, ITGA1, ITGA5, ITGA7, ITGA11, ITGAX, ITGAM, ITGB1, and ITGB5 were constructed using TCGA data and have shown upregulation of signature-related genes indicated worse outcomes [26].
Further, upregulated genes, FN1, COL1A1, and downregulated genes ITGB2, ITGAM, ITGAX were uploaded to miRTargetLink 2.0. hsa-let-7g-5p, hsa-miR-1- 3p, hsa-miR-140-3p, hsa-miR-200b-3p, hsa-miR-200c-3p target FN1 gene and these miRNAs found downregulated in our earlier study. A study by Shirinsokhan et al observed four proteins, SPARC, INHBA, FN1 and GBA, significantly increased in breast cancer in comparison with controls and, with the MienTURNET database, identified hsa-miR-200b-3p/hsa-miR-200c-3p/has-miR-429 target FN1 [27]. A study by Yang et al has shown miR-200b can directly target FN1 to regulate the EMT of breast cancer cells, and increase the sensitivity of cancer cells to doxorubicin [28]. COL1A1-targeting miRNAs hsa-miR-129-5p, hsa-miR-133a-3p, hsa-miR-185-5p, hsa-miR-29b-1-5p, hsa-miR-29b-3p, hsa-miR-29c-3p that were downregulated in our study. For the downregulated genes ITGB2, ITGAM, and ITGAX, weakly validated miRNA was observed and for the ITGAM gene as a target no miRNA was identified by the miRTargetLink 2.0 tool. The limitation of the present study is experimental validation of up- and down-regulated genes and miRNAs which target these genes.
In conclusion, this study observed several key genes in the stroma of TNBC, including FN1, COL1A1, ITGB2, ITGAM and ITGAX, and may have immunosuppressive effects leading to tumor growth, angiogenesis, invasion, and metastasis. Many studies have shown FN1 and COL1A1 are the two genes that may be promising targets for TNBC.
Acknowledgments
Statement of Transparency and Principals:
• Author declares no conflict of interest
• Study was approved by Research Ethic Committee of author affiliated Institute.
• Study’s data is available upon a reasonable request.
• All authors have contributed to implementation of this research.
Funding Agency:
Gujarat State Biotechnology Mission, Government of Gujarat, Gujarat, INDIA
References
- The extracellular matrix in tumor progression and metastasis Eble JA , Niland S. Clinical & Experimental Metastasis.2019;36(3). CrossRef
- Targeting the tumor microenvironment in B-cell lymphoma: challenges and opportunities Liu Y, Zhou X, Wang X. Journal of Hematology & Oncology.2021;14(1). CrossRef
- Extracellular matrix remodeling in tumor progression and immune escape: from mechanisms to treatments Yuan Z, Li Y, Zhang S, Wang X, Dou H, Yu X, Zhang Z, Yang S, Xiao M. Molecular Cancer.2023;22(1). CrossRef
- The role of collagen in cancer: from bench to bedside Xu S, Xu H, Wang W, Li S, Li H, Li T, Zhang W, Yu X, Liu L. Journal of Translational Medicine.2019;17(1). CrossRef
- Collagen Matrix Density Drives the Metabolic Shift in Breast Cancer Cells Morris Brett A., Burkel Brian, Ponik Suzanne M., Fan Jing, Condeelis John S., Aguirre-Ghiso Julio A., Castracane James, Denu John M., Keely Patricia J.. EBioMedicine.2016;13. CrossRef
- RETRACTED: Collagen prolyl hydroxylases are essential for breast cancer metastasis Gilkes DM , Chaturvedi P , Bajpai S , Wong CC , Wei H , Pitcairn S , Hubbi ME , Wirtz D , Semenza GL . Cancer Res.2013;73(11):3285-3296.
- Comparative genomic hybridisation and transcriptome microarray analysis in triple negative breast cancer: An INDIAN study Vora H , Desai M , Patel G , Patel N , Patel P . ResearchGate.2024. CrossRef
- Identification of potential genes related to breast cancer brain metastasis in breast cancer patients Zhang L, Wang L, Yang H, Li C, Fang C. Bioscience Reports.2021;41(10). CrossRef
- FN1 mediated activation of aspartate metabolism promotes the progression of triple-negative and luminal a breast cancer Chen C, Ye L, Yi J, Liu T, Li Z. Breast Cancer Research and Treatment.2023;201(3). CrossRef
- Systematic identification of the key candidate genes in breast cancer stroma Wang Y, Xu H, Zhu B, Qiu Z, Lin Z. Cellular & Molecular Biology Letters.2018;23. CrossRef
- Bioinformatics analysis of gene expression profiles to identify causal genes in luminal B2 breast cancer Wang J, Du Q, Li C. Oncology Letters.2017;14(6). CrossRef
- Collagen type I induces disruption of E-cadherin-mediated cell-cell contacts and promotes proliferation of pancreatic carcinoma cells Koenig A, Mueller C, Hasel C, Adler G, Menke A. Cancer Research.2006;66(9). CrossRef
- Collagen I promotes epithelial-to-mesenchymal transition in lung cancer cells via transforming growth factor-beta signaling Shintani Y, Maeda M, Chaika N, Johnson KR , Wheelock MJ . American Journal of Respiratory Cell and Molecular Biology.2008;38(1). CrossRef
- Targeting integrin pathways: mechanisms and advances in therapy Pang X, He X, Qiu Z, Zhang H, Xie R, Liu Z, Gu Y, Zhao N, Xiang Q, Cui Y. Signal Transduction and Targeted Therapy.2023;8(1). CrossRef
- Screening of Critical Genes Involved in Metastasis and Prognosis of High-Grade Serous Ovarian Cancer by Gene Expression Profile Data Wang R, Du X, Zhi Y. Journal of Computational Biology: A Journal of Computational Molecular Cell Biology.2020;27(7). CrossRef
- In silico transcriptomic mapping of integrins and immune activation in Basal-like and HER2+ breast cancer Rojas K, Baliu-Piqué M, Manzano A, Saiz-Ladera C, García-Barberán V, Cimas FJ , Pérez-Segura P, Pandiella A, Győrffy B, Ocana A. Cellular Oncology (Dordrecht, Netherlands).2021;44(3). CrossRef
- Downregulation of MiR-196b-5p impedes cell proliferation and metastasis in breast cancer through regulating COL1A1 Zhu X, Rao X, Yao W, Zou X. American Journal of Translational Research.2018;10(10).
- The Profile and Clinical Significance of ITGB2 Expression in Non-Small-Cell Lung Cancer Zu L, He J, Zhou N, Zeng J, Zhu Y, Tang Q, Jin X, Zhang L, Xu S. Journal of Clinical Medicine.2022;11(21). CrossRef
- Genomic Characteristics of Triple-Negative Breast Cancer Nominate Molecular Subtypes That Predict Chemotherapy Response Kim J, Yu D, Kwon Y, Lee KS , Sim SH , Kong S, Lee ES , Park IH , Park C. Molecular cancer research: MCR.2020;18(2). CrossRef
- Prognostic signature of ovarian cancer based on 14 tumor microenvironment-related genes Nie X, Song L, Li X, Wang Y, Qu B. Medicine.2021;100(28). CrossRef
- Integrin CD11b activation drives anti-tumor innate immunity Schmid MC , Khan SQ , Kaneda MM , Pathria P, Shepard R, Louis TL , Anand S, et al . Nature Communications.2018;9(1). CrossRef
- Biomechanical Contributions to Macrophage Activation in the Tumor Microenvironment Hoffmann EJ , Ponik SM . Frontiers in Oncology.2020;10. CrossRef
- Computational analysis of mRNA expression profiles identifies the ITG family and PIK3R3 as crucial genes for regulating triple negative breast cancer cell migration Klahan S, Wu M, Hsi E, Huang C, Hou M, Chang W. BioMed Research International.2014;2014. CrossRef
- Integrating Genomic Information with Tumor-Immune Microenvironment in Triple-Negative Breast Cancer Otohinoyi D, Kuchi A, Wu J, Hicks C. International Journal of Environmental Research and Public Health.2022;19(21). CrossRef
- Prediction and analysis of novel key genes ITGAX, LAPTM5, SERPINE1 in clear cell renal cell carcinoma through bioinformatics analysis Sui Y, Lu K, Fu L. PeerJ.2021;9. CrossRef
- Establishment of a novel prognostic signature based on an identified expression profile of integrin superfamily to predict overall survival of patients with colorectal adenocarcinoma Yu J, Yang K, Zheng J, Sun X, Zhao W. Gene.2022;808. CrossRef
- Selection hub MicroRNAs as biomarkers in breast cancer stem cells in extracellular matrix using bioinformatics analyses Shirinsokhan A, Azarmehr Z, Jalili A, Sadrabadi AE , Partan AS , Tutunchi S, et al . ResearchGate.2024. CrossRef
- miR-200b regulates epithelial-mesenchymal transition of chemo-resistant breast cancer cells by targeting FN1 Yang X, Hu Q, Hu L, Lin X, Liu J, Lin X, Dinglin X, et al . Discovery Medicine.2017;24(131).
License

This work is licensed under a Creative Commons Attribution-NonCommercial 4.0 International License.
Copyright
© Asian Pacific Journal of Cancer Biology , 2025
Author Details